What Are the Best YouTube Metrics for Growth? (5 That Actually Matter)
YouTube Studio shows 20+ metrics. Five actually predict channel growth. Here's which ones to track, what benchmarks to hit, and how to read them together.
YouTube Analytics for Creators → How to Track Your YouTube Analytics in Excel → You Don’t Have a Content Problem. You Have a Feedback Problem. → What Is a Good CTR on YouTube? → What Are the Best YouTube Metrics for Growth? (you’re here)
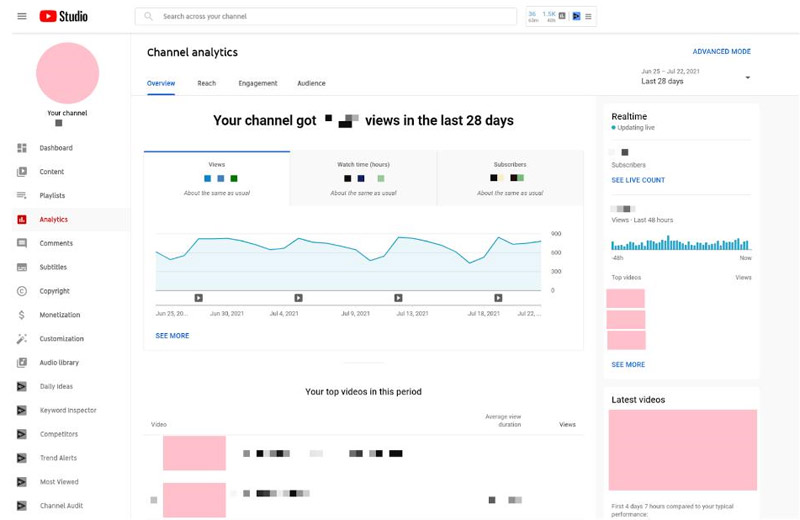
TL;DR: YouTube Studio tracks 20+ metrics. Five actually predict whether your channel grows: CTR, average view duration %, views in first 48 hours, subscriber gain per video, and monthly watch hours. Track those five. Ignore the rest until you have a specific problem to debug.
You open YouTube Studio. There are 20+ metrics waiting.
Impressions. CTR. Views. Watch time. Likes. Comments. Card CTR. End screen CTR. Unique viewers. Returning viewers. Revenue. Shares.
Which one tells you if you’re going to grow?
Most creators don’t know. So they check all of them, feel overwhelmed, and end up making decisions based on total views — which is one of the least predictive metrics for long-term channel growth.
Here’s the short answer. Then the full breakdown.
What YouTube metrics matter most for growth?
Five metrics drive growth. Everything else is either a lagging indicator or useful only for diagnosing a specific problem.
| Metric | What it measures | Why it predicts growth | Verdict |
|---|---|---|---|
| Click-through rate (CTR) | % of impressions that became clicks | Direct algorithm signal — YouTube shows what gets clicked | Core |
| Average view duration % | % of the video watched on average | Tells the algorithm whether content delivers on the thumbnail’s promise | Core |
| Views in first 48 hours | Velocity at publication | Determines whether YouTube amplifies the video to non-subscribers | Core |
| Subscriber gain per video | Viewers who converted to subscribers | Measures audience fit and long-term channel health | Core |
| Monthly watch hours | Total hours watched channel-wide | Primary monetization threshold and compound growth signal | Core |
These five work together as a system. High CTR with low view duration means the thumbnail over-promises the content. Low CTR with high view duration means the content is great but packaging is weak. You need to read them in combination — not one at a time.
BravePicks: In YouTube data tracked through our templates, the most common growth ceiling appears when creators optimize CTR without monitoring view duration. The algorithm rewards the combination. Neither metric alone is sufficient.
Average view duration percentage: the metric most creators skip
Total watch time (in minutes) appears in every analytics breakdown. Average view duration as a percentage is easy to overlook — and it’s more important.
Here’s why the percentage matters:
| Video length | Avg watch time | Duration % | Signal |
|---|---|---|---|
| 5-minute video | 3 min | 60% | Strong |
| 10-minute video | 3 min | 30% | Weak |
| 15-minute video | 3 min | 20% | Poor |
Three minutes of watch time looks identical in absolute terms. As a percentage of video length, the algorithm sees three completely different situations.
Benchmarks by video length:
| Video length | Solid | Strong | BravePicks verdict |
|---|---|---|---|
| Under 3 min | 70%+ | 85%+ | Rarely worth optimizing separately |
| 3–5 min | 55%+ | 70%+ | Strong hook needed |
| 5–10 min | 40%+ | 55%+ | Standard target range |
| 10–20 min | 35%+ | 50%+ | Solid for long-form |
| 20+ min | 30%+ | 40%+ | Good for depth-focused content |
When view duration % is consistently below these benchmarks, the problem is almost always the first 30 seconds — the hook isn’t working, or the content isn’t delivering what the opening promised.
Click-through rate: still the entry gate
The best content on YouTube goes nowhere if no one clicks the thumbnail.
CTR is the entry gate. View duration is what happens after. Both are required.
For a full breakdown of CTR benchmarks by channel size, content type, and what to do when it’s low, see What Is a Good CTR on YouTube? — it covers the full segmented benchmark table.
The summary:
| Channel size | Normal CTR range | BravePicks verdict |
|---|---|---|
| Under 10K subs | 5–10% | Normal — audience is mostly subscribers who click readily |
| 10K–100K | 4–7% | Solid — reaching new audiences at scale |
| 100K–1M | 3–6% | Expected as impressions broaden |
| 1M+ | 2–5% | Healthy at this scale |
The trap: optimizing CTR in isolation. A video with 10% CTR and 20% view duration will be suppressed faster than one with 5% CTR and 55% view duration. Log both in the same row and read them together.
Views in the first 48 hours: the velocity signal
YouTube decides within the first 24–48 hours whether to amplify a video to non-subscribers.
This window is the most decisive moment in a video’s lifecycle.
What drives 48-hour velocity:
- Notification subscribers — your most engaged audience clicking immediately
- Thumbnail + title strength — browse feature CTR from early impressions
- Upload timing — posting when your existing audience is active
How to use it: log 48-hour views for every video. After 20+ uploads, you’ll know your channel’s baseline. Any video clearing 1.5–2× your baseline in 48 hours typically gets pushed harder in the following week.
Videos that underperform in the first 48 hours rarely recover — the amplification window closes. This is why systematic per-video tracking matters more than occasional Studio check-ins.
Subscriber gain per video: the audience-fit signal
Total subscribers is a vanity metric. Subscriber gain per video is a diagnostic tool.
It tells you which content attracts people who want to see more from you specifically.
| Subscriber gain per video | Signal |
|---|---|
| Well above channel average | Strong topic-audience fit — make more of this |
| At channel average | Normal — content is on-brand |
| Below channel average | Topic or format mismatch |
| Negative | Serious misalignment — video attracted the wrong audience |
Watch the ratio, not the absolute number. A new channel gaining 3 subs per video is doing fine. An established channel at 50K subscribers gaining 3 subs on a video with 10K views has a conversion problem worth investigating.
BravePicks: The most actionable use of subscriber gain per video: identify the 3–5 videos in your history with the highest subscriber conversion rate. Those videos reveal your best-fit content category — what your specific audience wants more of.
Monthly watch hours: the compound signal
Watch hours are the compound interest of YouTube.
They matter for three distinct reasons:
- Monetization threshold — 4,000 watch hours in the last 12 months is required for YouTube Partner Program eligibility
- Algorithm ranking — channels with consistently growing watch hours receive broader distribution over time
- Growth benchmark — monthly watch hours trending upward over 6+ months is the clearest signal of sustainable growth
Track it monthly, not video-by-video. A single viral video can spike watch hours without reflecting real channel momentum. Consistent monthly trends tell the actual story.
How to read these five metrics together
The metrics only make sense in combination. A single metric in isolation is almost always misleading.
| Pattern | Diagnosis | What to do |
|---|---|---|
| High CTR + high duration % | Algorithm goldmine — format and content both working | Scale: more of this format and topic |
| High CTR + low duration % | Thumbnail over-promises | Fix opening 60 seconds or adjust the title |
| Low CTR + high duration % | Great content, weak packaging | Test new thumbnails — the content itself is working |
| Low CTR + low duration % | Both problems present | Start with thumbnail (highest-leverage fix) |
| High subs/video + low views | Niche-perfect content — audience fit is strong | Promote more actively; conversion is already there |
Reading these five together is what the YouTube Analytics Tracker PRO is built for — it logs all five per video and surfaces patterns side-by-side, so the diagnosis is visible without manual comparison.
Which YouTube metric should you focus on first?
Depends on where your channel is.
Under 5K subscribers: Focus on CTR and average view duration %. These two signals determine whether YouTube recommends you to anyone beyond your existing audience. Without them, nothing else compounds.
5K–50K subscribers: Add 48-hour velocity tracking. You have enough subscribers for the notification window to matter. Identify your baseline and work to beat it consistently.
50K+ subscribers: Monthly watch hours becomes the primary signal. Individual video CTR still matters, but total channel watch time growth is what drives distribution at scale.
The YouTube Analytics Tracker MINI covers the first stage — CTR and view duration per video — in four sheets, $2.99 one-time.
The PRO version adds monthly watch hours tracking, subscriber gain trends, format analysis, and goals — the full system for the 5K–50K phase and beyond.
People also ask
What are the most important YouTube metrics for growth?
The five that most reliably predict growth: click-through rate, average view duration %, views in the first 48 hours, subscriber gain per video, and monthly watch hours. CTR and view duration are the most direct algorithm signals — YouTube surfaces content that gets clicked and watched. The others tell you whether that growth is sustainable and whether you’re attracting the right audience.
What is a good average view duration on YouTube?
For videos over 8 minutes, 40–50% average view duration is solid — meaning viewers watch nearly half on average. Above 50% is strong. For videos under 5 minutes, aim for 60–70%. The percentage matters more than absolute minutes — a 3-minute average on a 5-minute video is a very different algorithm signal than 3 minutes on a 15-minute video.
Should I focus on views or subscribers on YouTube?
Neither is the most useful metric to optimize directly. Views are driven by CTR and watch time. Subscribers follow from audience fit. Focus on CTR × view duration as the primary signal, then use subscriber gain per video to understand which content attracts your best audience. Views and subscribers compound from those inputs.
How do I know if my YouTube channel is growing?
Track monthly watch hours, subscriber growth rate, and per-video CTR trend over at least 6 months. A channel is genuinely growing when all three trend upward across that window. A single viral video or subscriber spike is an event, not growth. Consistent upward movement across multiple metrics is the real signal.
Why do some YouTube videos suddenly stop getting views?
Most view drops are algorithm-driven: the video’s watch time signal declined as the initial audience segment exhausted itself, and YouTube moved on to other content. Videos with both strong CTR and high view duration percentage have longer growth curves. Videos that spike quickly and drop fast typically had front-loaded interest without sustained watch time to back it up.
How many YouTube metrics should I actually track?
Start with five: CTR, average view duration %, 48-hour views, subscriber gain per video, and monthly watch hours. Add more only when you have a specific hypothesis — traffic sources if you’re running SEO, audience retention curves if you’re debugging a specific drop-off. More metrics without a specific question just creates noise.
From this article
Content Creators
YouTube Analytics Tracker PRO
A data-driven system to analyze your videos, identify patterns, and grow your YouTube channel faster — not another tracker.